Why Compare and Contrast?
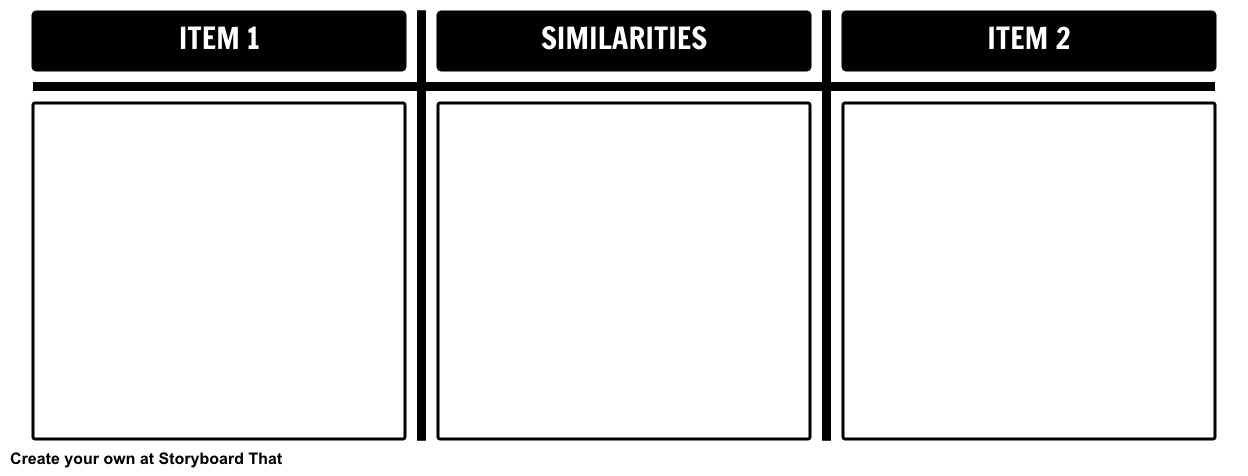
Comparing and contrasting items allows our students to practice thinking analytically. They have to figure out how the items are the same (compare) and how they are different (contrast). The ability to think also aligns with the basic concept of Common Core, which is ensuring our students are learning by process rather than just memorizing. Many of us are familiar with the Venn Diagram model for comparing and contrasting. Storyboard That took that model and adapted the compare and contrast concept to work with the storyboard approach using a T-Chart.
Contrasting Differences
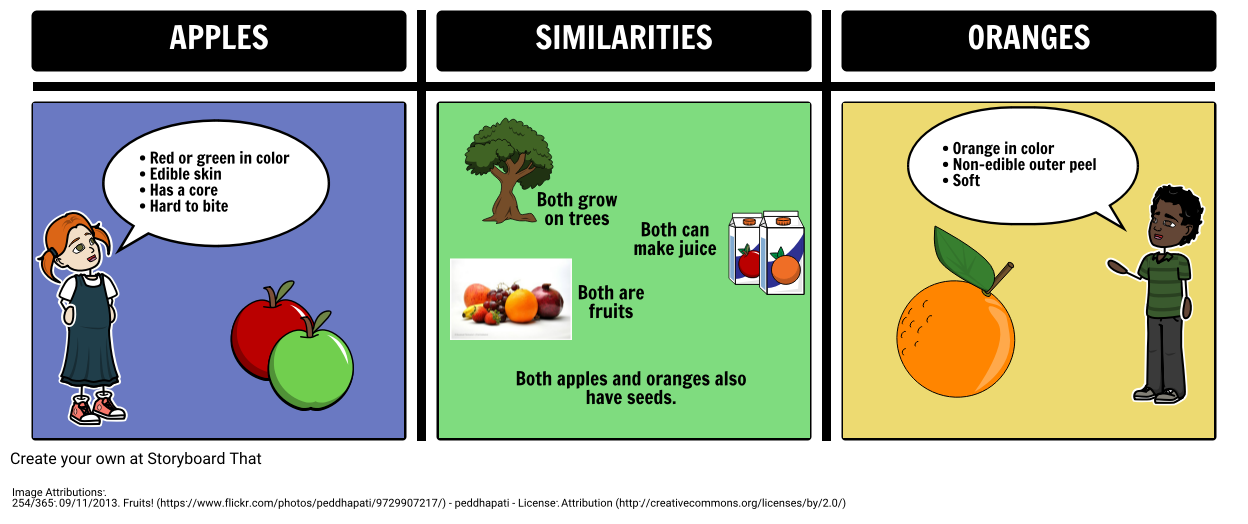
In a three-column format of a T-Chart graphic organizer, the two items are in the first and last cells. In these cells, only one of the items is described at a time. For example, if contrasting apples and oranges, the apple will have one cell and the orange will also have one cell. Within each of their respective cells, only details pertinent to that particular fruit will be recorded there.
Comparing Similarities
After the unique qualities of both apples and oranges have been described, the user describes the qualities or attributes that the items have in common. Comparing lets students make connections to two objects, people, or ideas, that they may not have considered before.
Though the description above explains completing the unique features of the items first, that is not a requirement. Many students may find it easier to complete the comparison aspect first or even to complete them together as they think of different qualities.
Fact vs. Opinion
In education, we spend a lot of time teaching our students how to think critically and to understand what they are learning. The resources we use in the classrooms are full of facts. Often there are also opinions included among the facts and it is important that students be able to distinguish between the two. Fact or Opinion can be used when teaching any subject to help students learn to distinguish within their resources. It would also be a helpful tool when teaching students about persuasive essays. They are often full of both facts and opinion and it can sometimes be difficult to identify between the two.
Pros and Cons
There are so many decisions facing children and youth today that it is important that we educate them to help guide them in making the correct ones. A pros and cons chart is a great way to demonstrate the thought process that goes into making an educated choice. The T-Chart layout is perfect for creating such a layout. A two-cell chart automatically creates the divide. A pros and cons format is great for all students, but can be especially great for students who struggle with making appropriate and safe choices.
Make Your Own Compare and Contrast Templates
This template is just that, a template. You are free to organize it anyway that works for you and your students and customize it based on their level and needs. The compare and contrast template is created using our T-Chart Layout. Learn more about this graphic organizer in our T-Chart article.
To create your own T-Chart follow these simple steps:- Open Storyboard Creator
- Click on “Storyboard Layout”
- Choose “T-Chart” layout
- Add or remove cells as needed, and click Okay! when done.
Related Activities
The compare and contrast format has a little something for everyone, and with Storyboard That, the addition of images makes learning fun! We are confident you will enjoy using it in your classroom.
How to Teach Comparing and Contrasting Historical Events using T-Charts
Select Historical Events
Choose two or more historical events that are suitable for comparison and contrast. Consider events that are significant, have clear connections, and provide rich opportunities for analysis.
Introduce the T-Chart and Purpose
Explain the purpose of comparing and contrasting historical events using T-charts. Introduce the T-chart structure and its columns for organizing information. Emphasize that the T-chart will help students identify similarities and differences between the events.
Research and Gather Information
Guide students in conducting research on the selected historical events. Provide reliable resources or direct students to appropriate sources. Encourage them to gather key details, causes, effects, important dates, and other relevant information about each event.
Fill Out the T-Chart
Demonstrate how to fill out the T-chart using the gathered information. Model the process by labeling the left column with one historical event and the right column with the other. Help students identify and record similarities and differences in each corresponding row of the T-chart.
Analyze and Draw Connections
Guide students in analyzing the information recorded in the T-chart. Encourage them to identify patterns, connections, and significant insights between the events. Discuss the implications of the similarities and differences and their impact on historical contexts or outcomes.
Make Conclusions and Reflect
Guide students in drawing conclusions based on their analysis. Help them synthesize their findings and reflect on the significance of comparing and contrasting historical events. Encourage students to articulate their insights, evaluate the historical events' impact, and discuss lessons learned from the comparison.
Frequently Asked Questions about Comparing and Contrasting with T-Charts
How can T-charts be used to promote critical thinking skills in students?
T-charts can help students develop critical thinking skills by encouraging them to compare and contrast different ideas or concepts. By identifying similarities and differences between two or more topics, students can begin to analyze and evaluate the significance and implications of those similarities and differences. This process can also help students develop their ability to make connections, draw conclusions, and communicate their ideas effectively.
Are there any limitations or drawbacks to using T-charts for compare and contrast activities in the classroom?
While T-charts are a useful tool for compare and contrast activities, there are some limitations and drawbacks to consider. For example, T-charts may not be suitable for comparing and contrasting complex or abstract concepts, as they may require more detailed or nuanced analysis than can be captured in a two-column format. Additionally, T-charts may not be suitable for all students, particularly those with visual or cognitive disabilities, who may require additional support or accommodations to fully engage with the activity.
How do T-charts differ from other graphic organizers that can be utilized for teaching compare and contrast lessons?
Other tools that can be used include Venn diagrams, matrices, and double bubble maps, among others. Compared to Venn diagrams, T-charts are simpler and easier to use, as they only require two columns for comparison while matrices may be more time-consuming to create and fill out than T-charts. Double bubble maps, also known as brainstorming maps or bubble charts, are useful for comparing and contrasting two different perspectives or points of view on a given topic. They can help students identify similarities and differences in how different groups or individuals view a particular issue.
- 254/365: 09/11/2013. Fruits! • peddhapati • License Attribution (http://creativecommons.org/licenses/by/2.0/)
- Drivers License -Teen driver • State Farm • License Attribution (http://creativecommons.org/licenses/by/2.0/)
- Fireworks • bayasaa • License Attribution (http://creativecommons.org/licenses/by/2.0/)
- Gambling Addiction • schnappischnap • License Attribution (http://creativecommons.org/licenses/by/2.0/)
- Pints of Beer • Simon Cocks • License Attribution (http://creativecommons.org/licenses/by/2.0/)
© 2026 - Clever Prototypes, LLC - All rights reserved.
StoryboardThat is a trademark of Clever Prototypes, LLC, and Registered in U.S. Patent and Trademark Office


