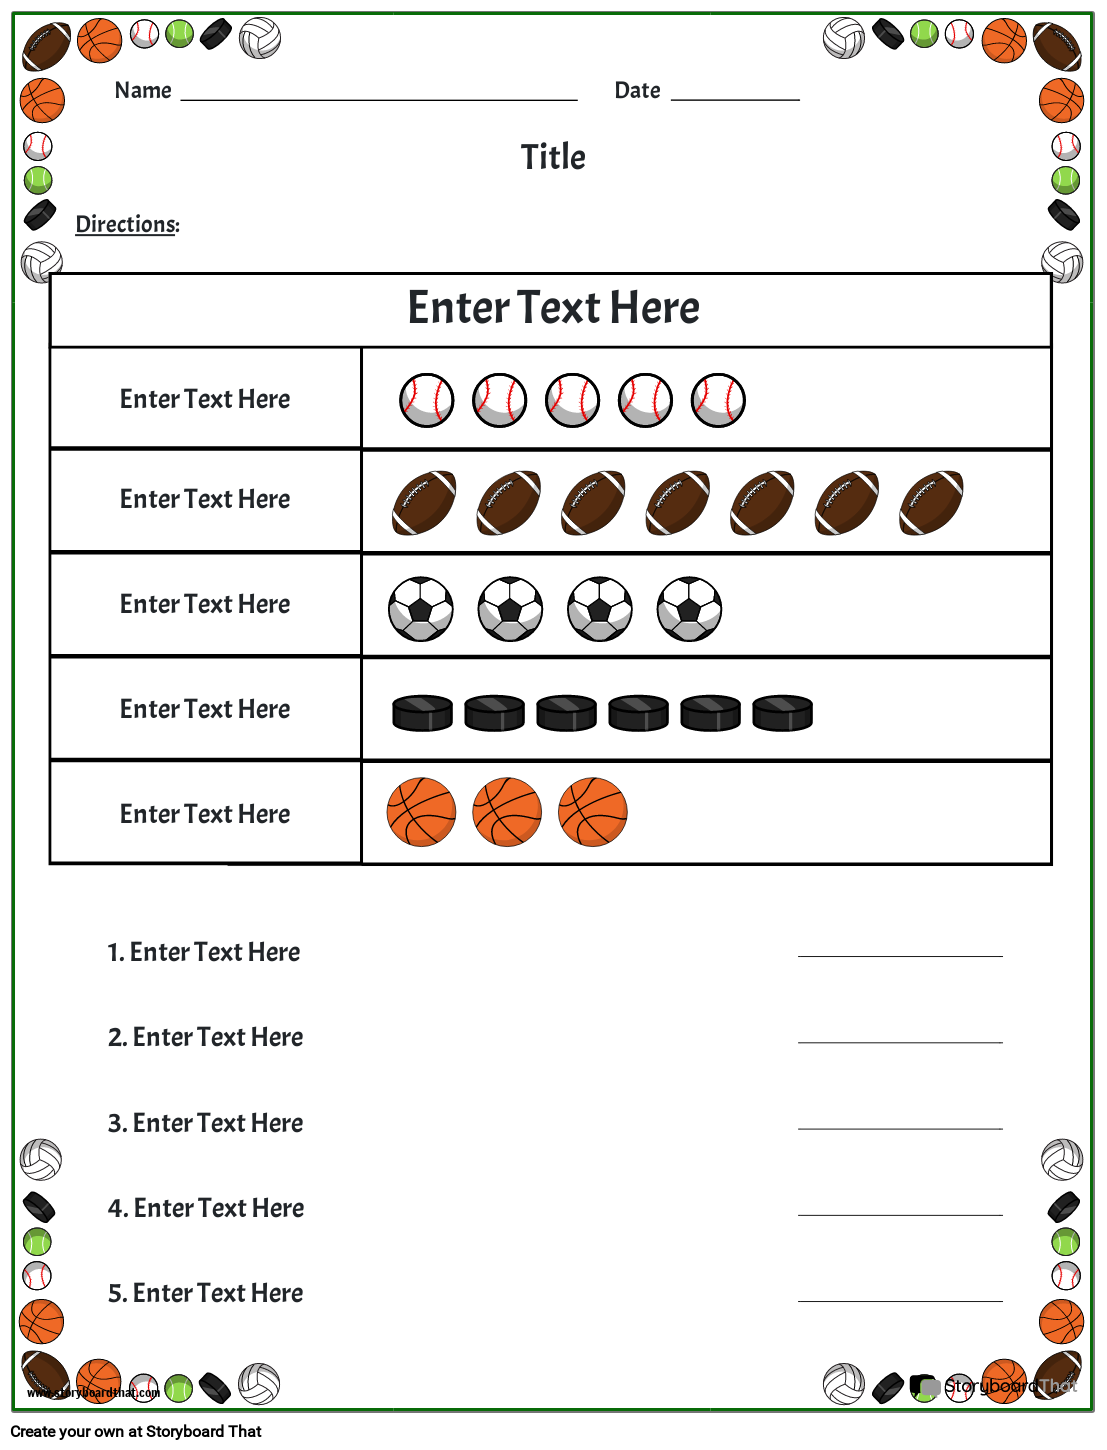
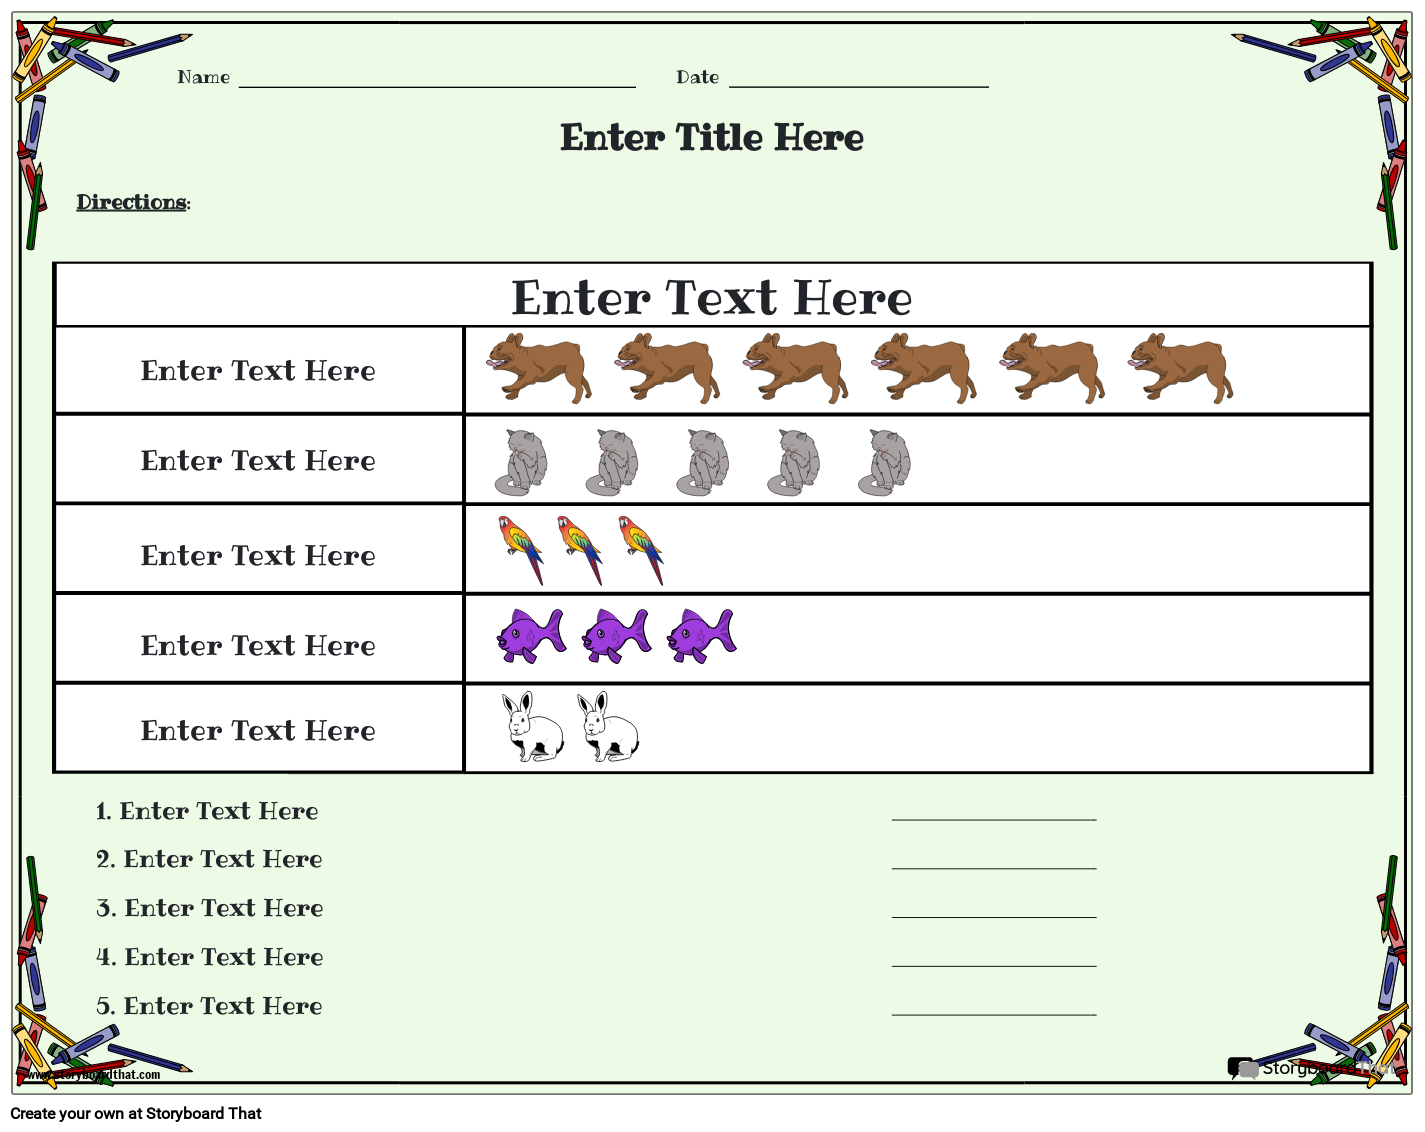
Customize Pictograph Worksheets
If you're assigning this to your students, copy the worksheet to your account and save. When creating an assignment, just select it as a template!

What is a Pictograph?
A pictograph is a visual used to represent data that combines the power of images with information. It starts with the process of collecting information from various sources. Then comes the crucial step of interpretation, where this information is translated into symbols or pictures that convey the data's meaning. Like other types of graphing such as bar graphs and circle graphs, pictographs are engaging tools that transform raw data into a story, making complex information more accessible and understandable for all.
How Can Pictograph Worksheets Elevate Data Understanding
Navigating the world of information with students becomes an exciting voyage when you embrace the power of pictograph worksheets. Our engaging resources are designed to effortlessly enhance comprehension in your classroom. Whether your students are in kindergarten or beyond, the journey of reading and analyzing pictographs becomes an adventure filled with meaningful discovery. They will love to collect and interpret data, and report their findings to their classmates. When students create and share something, not matter what grade they are in, they feel accomplished and proud.
Unlocking Data Mysteries Through Symbols
Our picture graphs unravel the mysteries of visual representation through simple yet potent symbols. These symbols are representations of numbers, creating a connection between quantitative information and visual expression. As students encounter these symbols on their worksheets, they're intuitively drawn into a world where data transcends mere digits and transforms into a language of its own.
From Charts to Characters: A World of Exploration
Using picture graph worksheets in your class is just like opening the door to a world of exploration for your students. It's like giving them a chance to discover new things. With these worksheets, they'll get to do activities like looking at simple charts and comparing different characters and the information they show. This journey will help nurture their thinking skills and creativity. The best part is that these worksheets are designed to make learning more engaging. It means your students won't just sit and listen – they'll be actively involved, which not only makes learning effective but also a lot of fun for them!
Adaptable Resources for Diverse Grades
Regardless of the grade you teach, our pictograph chart caters to varying levels of understanding. Beginning with simple representations that lay a foundation of data literacy, we gradually introduce more intricate concepts with our math worksheets. This adaptability ensures that each student finds the perfect balance of challenge and clarity, fostering a sense of accomplishment and confidence in their interpretation skills.
Empowering Educators with Pictograph Templates
Beyond benefiting students, our resources are designed to empower educators too. These templates with different themes act as your creative canvas, allowing you to craft customized worksheets that align with your teaching objectives. This means you can effortlessly tailor lessons to suit your classroom's unique needs, ensuring that every student experiences the joy of mastering visualization.
Tips to Create a Pictograph Worksheet Using Our Pictograph Maker
Crafting a captivating and engaging pictograph worksheet becomes a breeze when you take advantage of the power of our pictograph generator. As an educator seeking to enrich your classroom experience with interactive and visually compelling materials, you'll find that creating a pictograph online is both seamless and rewarding.
- Select Your Story: Begin by choosing a story that resonates with your students. It could be anything from favorite animals to types of transportation. Selecting relatable topics ensures that students are drawn into the activity.
- Gather Your Data: Collect the information you'll be using. Whether you choose to survey your students or use existing data, make sure it's accurate and relevant. This is a good opportunity to introduce the tally chart and practice using tally marks.
- Choose Symbols: Next, select symbols that match the theme. Keep them simple and clear, as the goal is to make the information visually comprehensible.
- Utilize Colors: Incorporate colors strategically to differentiate the symbols and enhance visual appeal.
- Design Your Pictograph: With the data, symbols, and colors in place, use our pictograph maker to design your printable worksheets. This online tool streamlines the process, allowing you to create an engaging graph effortlessly.
- Save and Share: Once you're satisfied with your creation, save it! Our pictograph creator enables you to save your worksheet for future use, ensuring that your effort is well-preserved. You can also share the worksheet with fellow educators, creating a collaborative environment where creative ideas flow freely.
By following these steps and using our pictograph maker, you're not only crafting a visually appealing worksheet but also immersing your students in a dynamic learning experience. These worksheets seamlessly combine education with enjoyment, fostering a deeper understanding of interpretation while keeping students engaged and excited to learn.
Pictograph Example Activities for Your Class
Whether you teach 1st grade, 2nd grade, 3rd grade, or higher, engaging your class becomes a breeze with the array of pictograph example activities at your fingertips. These activities, designed to seamlessly integrate into your classroom and encourage a higher level thinking process, not only bring information to life but also foster essential skills in a fun and interactive way. Let's dive into some simple yet effective activities that leverage the power of our free pictograph worksheets.
- Drawing Pictographs Together: For younger levels, start by introducing your class to the basics of these graphs. Together, draw a simple pictograph on the board using familiar things, like favorite colors or fruits. This hands-on approach not only helps them understand the process of creating a pictograph but also sparks their curiosity and shows them how to read pictographs.
- Student-Created Pictographs: Encourage your students to become data creators by having children create their own. Provide them with a topic, such as favorite sports or hobbies, and let them gather information from their classmates.
- Reading and Answering Questions: Distribute a picture graph worksheet where learners need to read a pictograph and answer questions after analysis. This hones their ability to interpret information from visuals and extract meaningful insights. For instance, they might read a pictograph showing the number of books read by different graders and answer questions related to that topic.
- Adding Subtraction to Pictographs: For higher graders, elevate the complexity by incorporating subtraction. Provide a pictograph displaying the number of apples and oranges in a basket, and ask students to find the difference.
- Creating Blank Pictographs: Hand out blank pictograph templates and have kids fill in the symbols themselves. This creative exercise not only reinforces their understanding of the process but also empowers them to express their findings in a unique way.
As you explore our engaging educational resources, don't miss the opportunity to seamlessly transition into the world of visualization and interactive learning. From images and text worksheets to labeling worksheets, and even flow chart worksheets, our collection offers diverse teaching tools. Dive into creative storytelling with our story cube template, and when it comes to data representation, our bar graph maker stands ready.
How to Make a Pictograph Worksheet
Choose One of the Premade Templates
We have lots of templates to choose from. Take a look at our example for inspiration!
Click on “Copy Template”
Once you do this, you will be directed to the storyboard creator.
Give Your Worksheet a Name!
Be sure to call it something related to the topic so that you can easily find it in the future.
Edit Your Worksheet
This is where you will include directions, specific images, and make any aesthetic changes that you would like. The options are endless!
Click "Save and Exit"
When you are finished, click this button in the lower right hand corner to exit your storyboard.
Next Steps
From here you can print, download as a PDF, attach it to an assignment and use it digitally, and more!
Happy Creating!
Frequently Asked Questions About Pictographs
What are pictographs?
Pictographs are graphical representations of data that use symbols or pictures to convey information. They are used to visually communicate data in a way that's easy to understand and engaging for students.
How to use the pictograph creator?
Creating pictograph worksheets using Storyboard That's pictograph creator is a straightforward process. You can select symbols, input data, and design your worksheet with ease. Once you're satisfied with your creation, you can save and share it with your students. This tool streamlines the process, saving you time while helping you create visually engaging materials that enhance data understanding in your classroom.
How can I access Storyboard That's pictograph resources?
Accessing Storyboard That's pictograph resources is simple. Visit the website and explore the range of options available, including free pictograph worksheets and the pictograph creator tool. You can utilize these resources to enrich your lessons and empower your students with engaging data visualization activities.
What is a pictograph used for?
Pictographs are commonly used to showcase information such as survey results, quantities, or preferences. They make data interpretation more accessible, transforming numbers into relatable visuals. Wondering what is the difference between a pictograph and a picture graph? In short, the main difference between a pictograph and a picture graph lies in the nature of the images or symbols used to represent information. Pictographs use pictures directly related to the data, while picture graphs use more abstract and generic symbols.
© 2026 - Clever Prototypes, LLC - All rights reserved.
StoryboardThat is a trademark of Clever Prototypes, LLC, and Registered in U.S. Patent and Trademark Office


