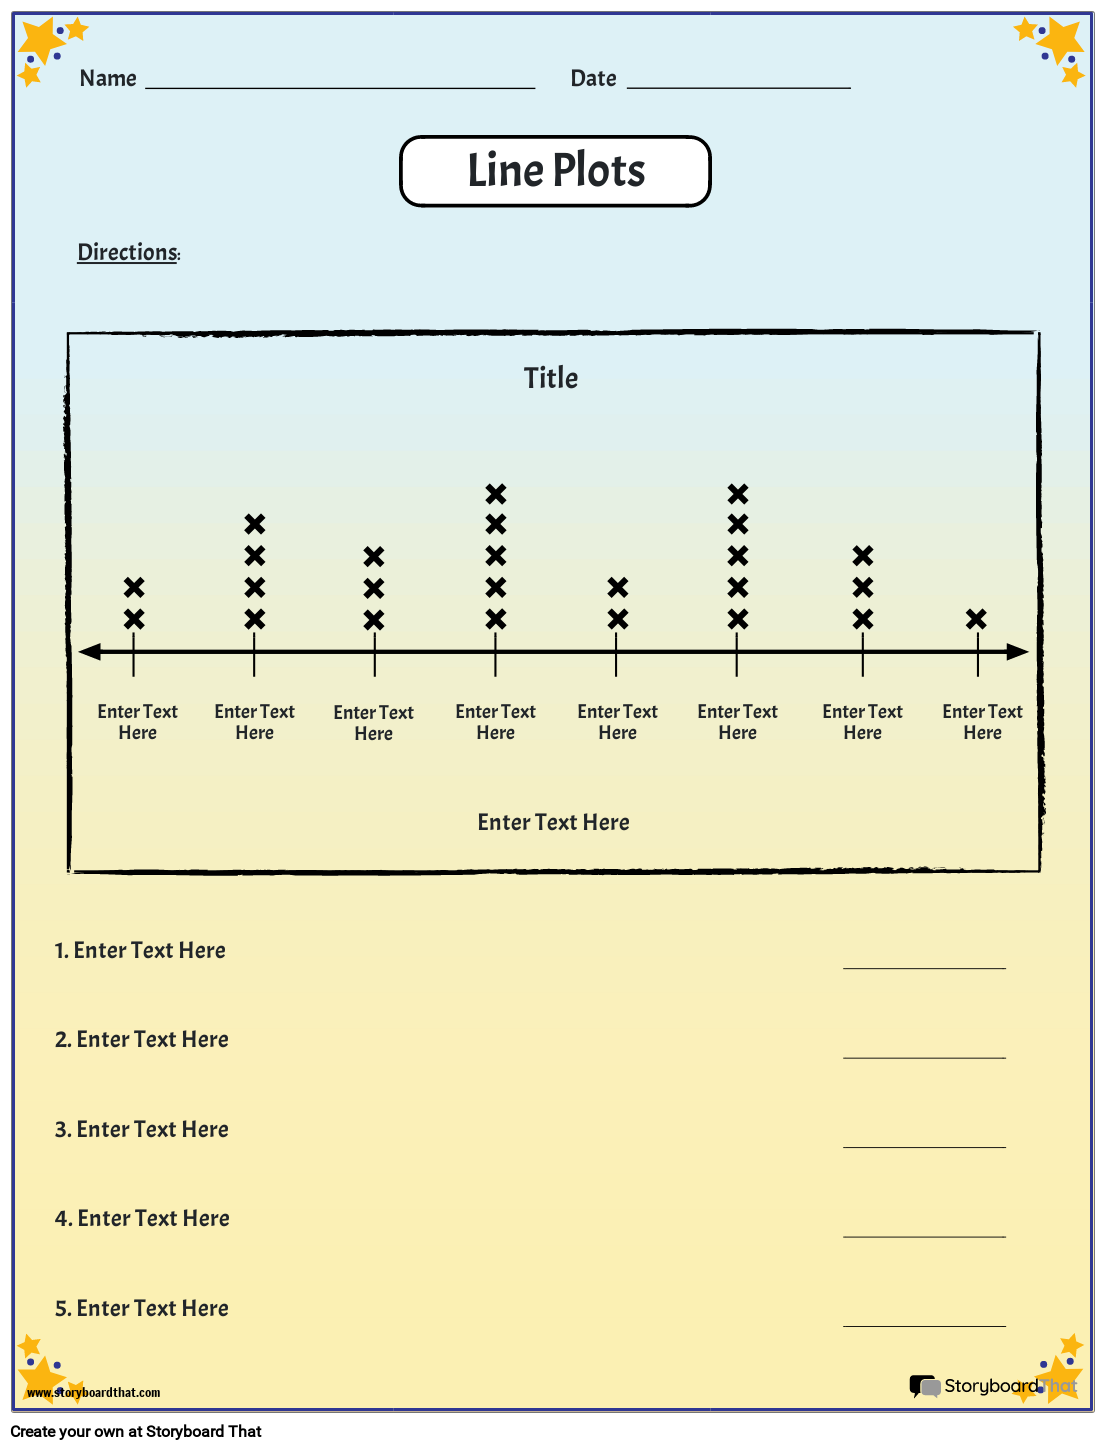
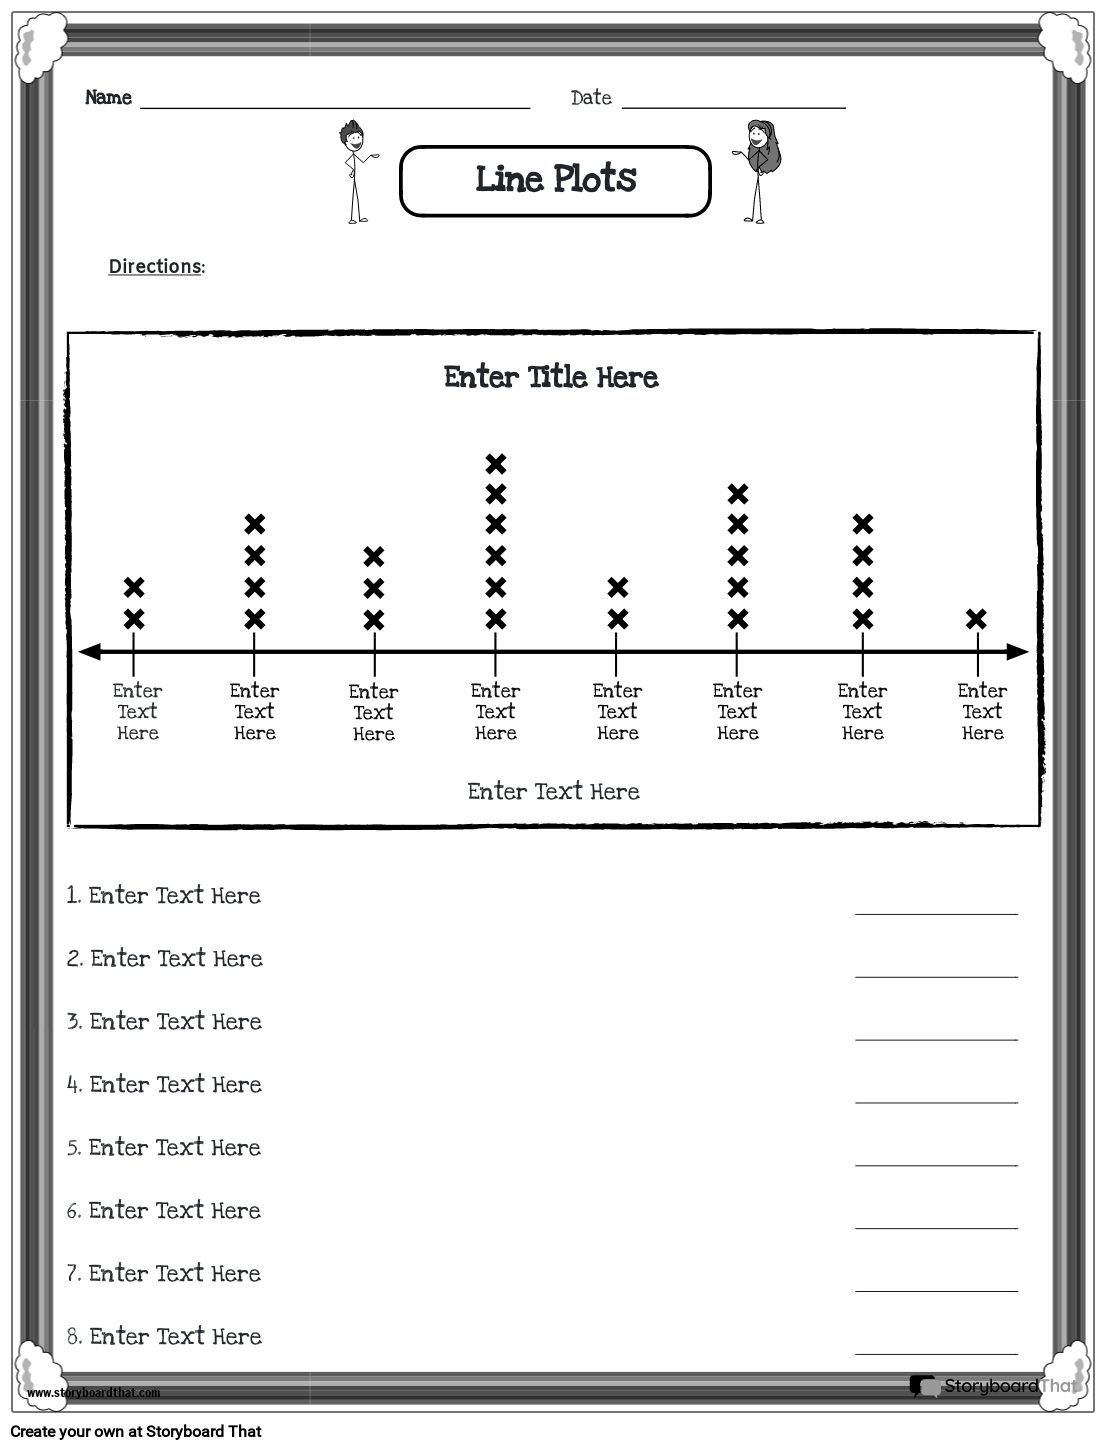
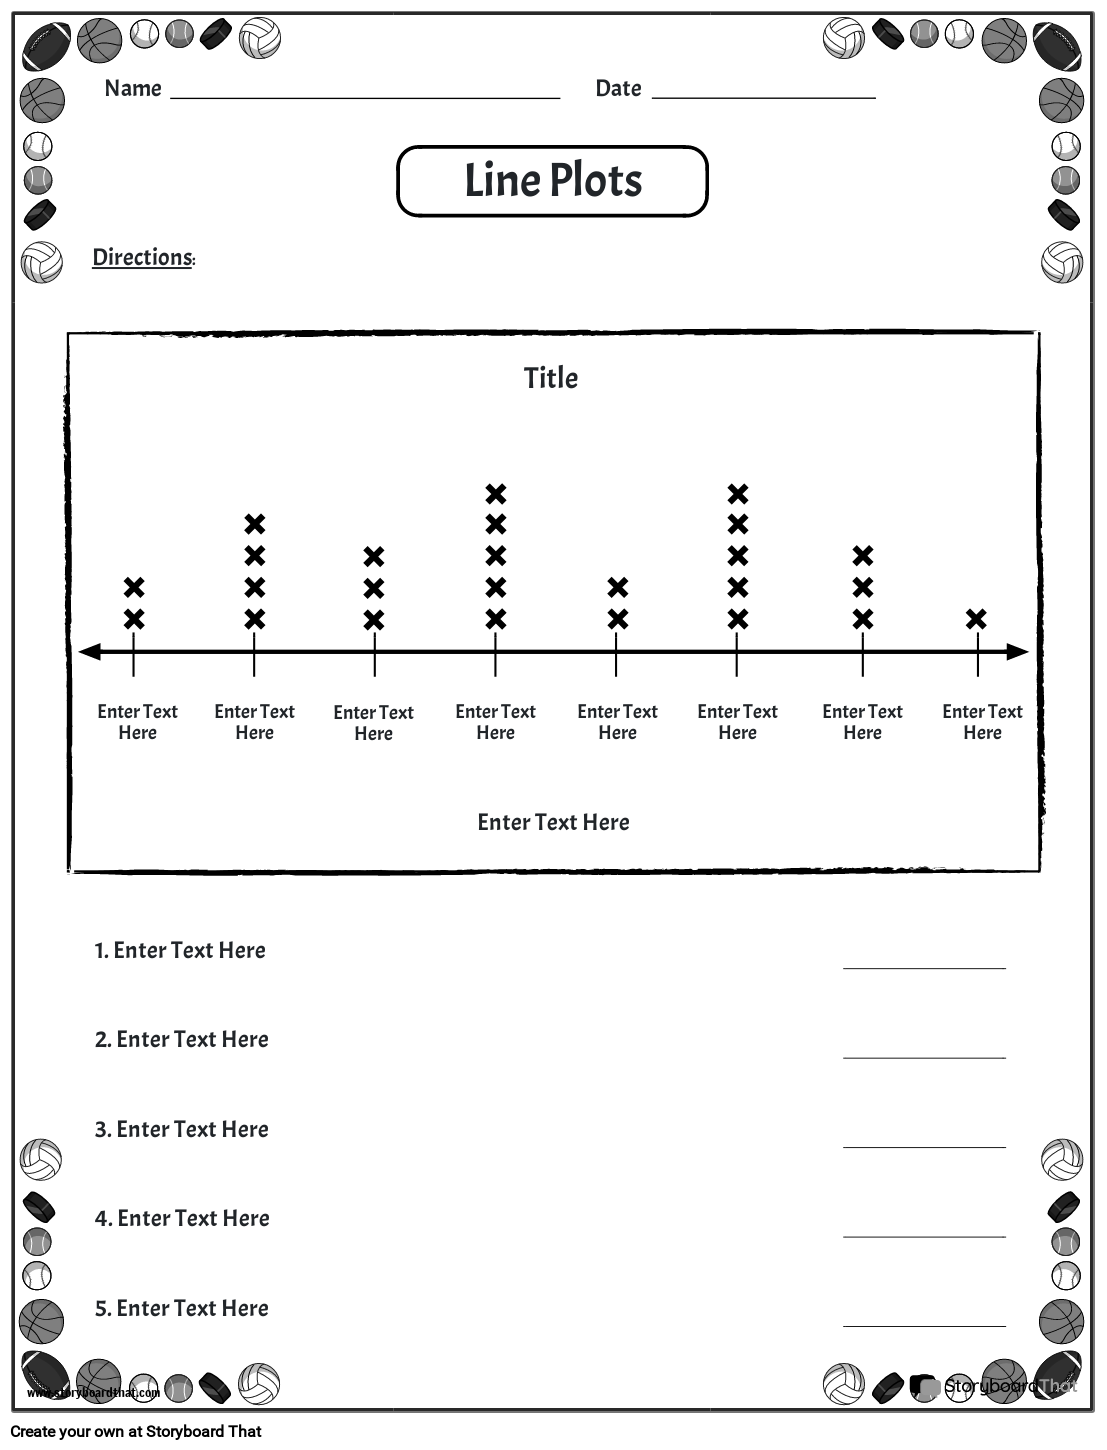
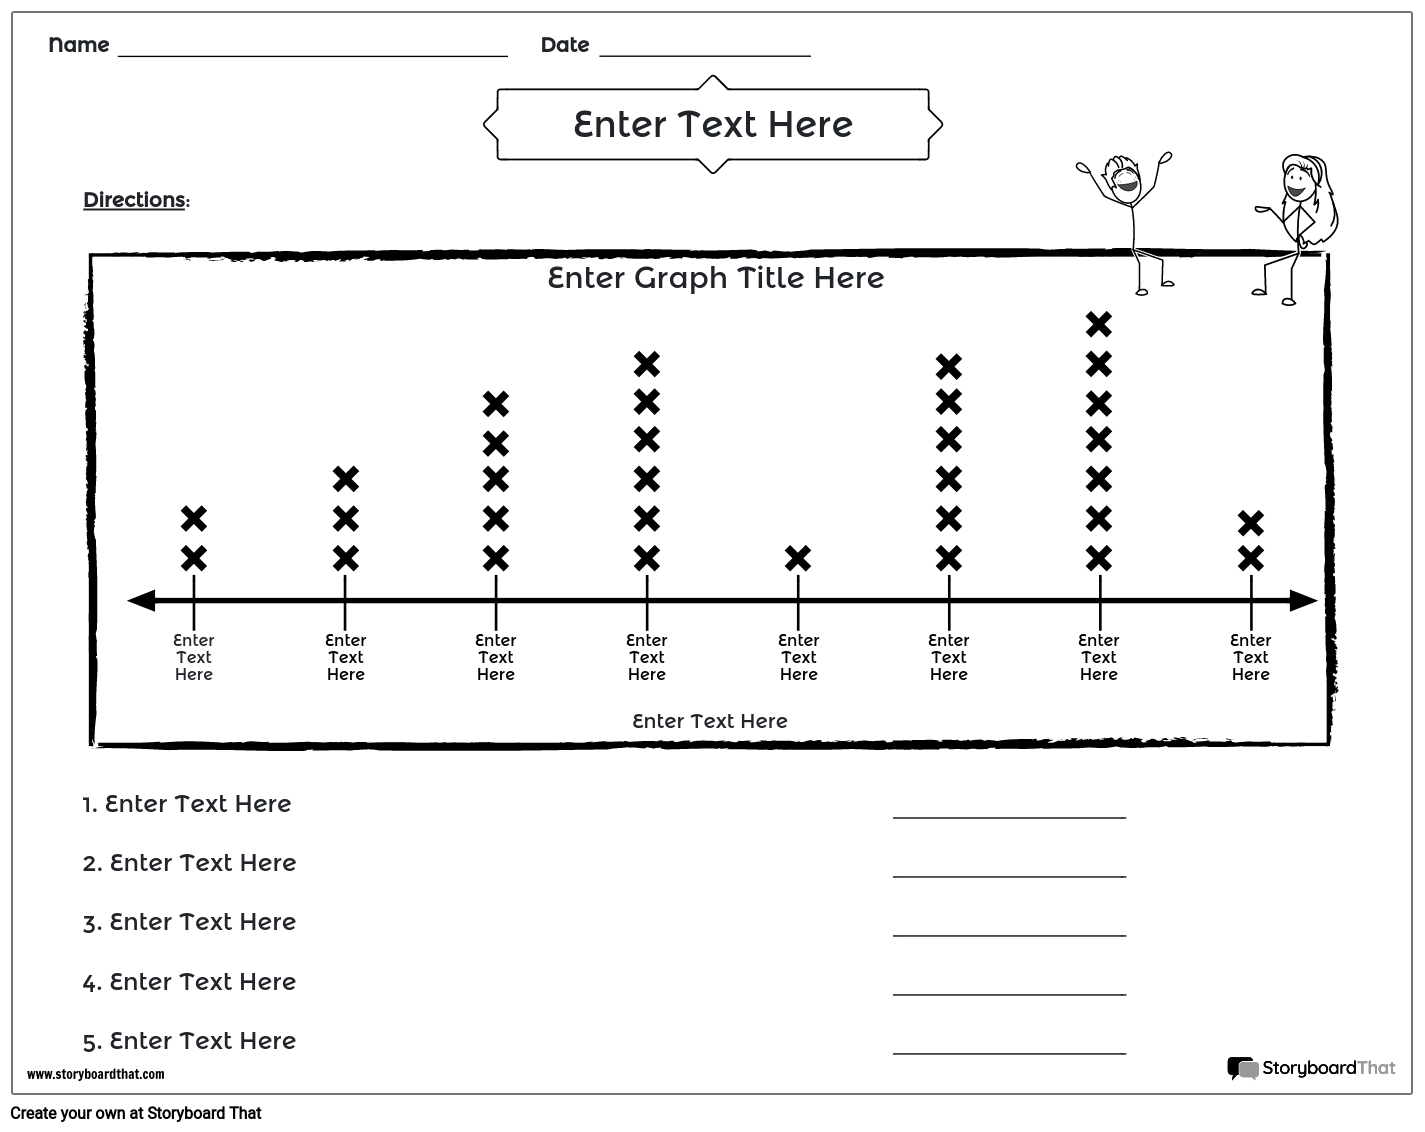
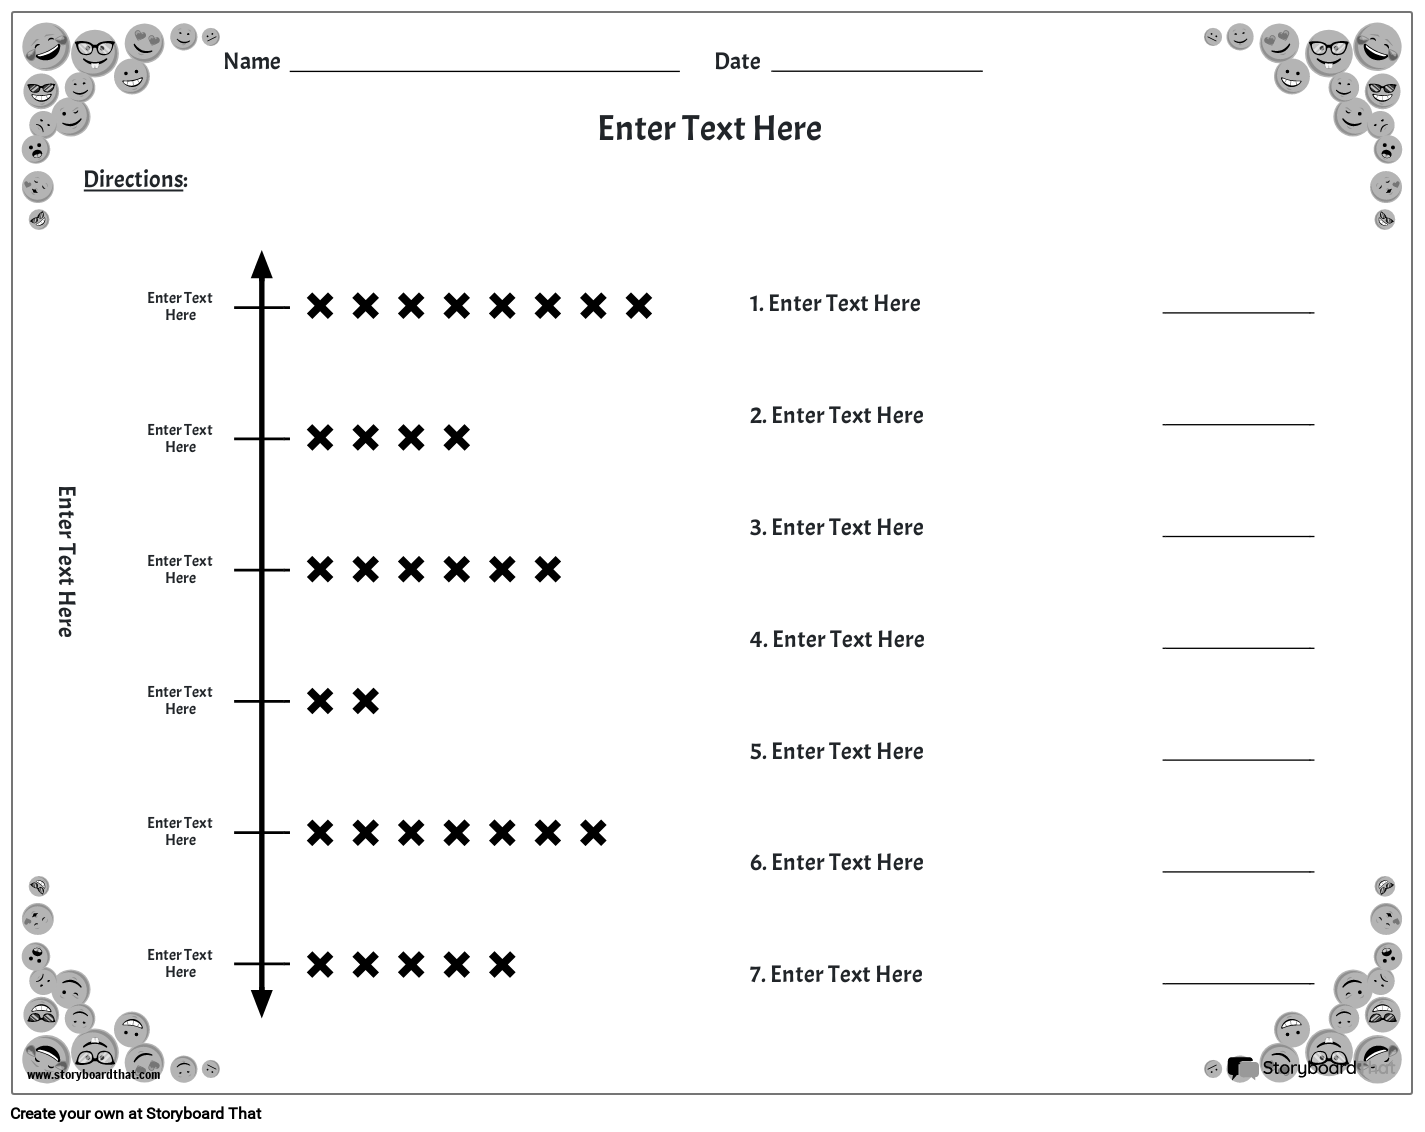
Customize Line Plot Worksheets
If you're assigning this to your students, copy the worksheet to your account and save. When creating an assignment, just select it as a template!

What is a Line Plot?
In the world of data visualization, a line plot stands as a fundamental tool for comprehending numerical information. Essentially, it is a graphical representation that utilizes a number line to portray a data set's values. This visual method offers a clear understanding of the distribution and frequency of points. By creating these, educators and students alike delve into the realm of graphs, gaining insights that facilitate a deeper grasp of patterns and frequencies. This knowledge serves as a stepping stone for fostering data literacy and enhancing analytical skills.
How to Introduce Line Plot for Kids: A Step-by-Step Guide to Data Visualization
Introducing the interesting world of line plots for kids comes with the promise of making data visualization an exciting adventure. With our step-by-step guide, young learners are gently guided through the process, transforming seemingly complex concepts into accessible and engaging experiences.
- Select a Relatable Data Set: Begin by choosing a data set that resonates with kids' interests, such as the number of books read in a month or the types of pets in the classroom. By connecting findings to their experiences, you pique their curiosity and lay the foundation for effective learning.
- Integrate Word Problems: Elevate the learning experience by integrating word problems that involve the chosen data set. Encourage students to read and decipher these problems, extracting relevant information and recognizing patterns that will later translate into plots. This approach adds a practical dimension to the process, allowing kids to see the real-world application of information representation.
- Utilize Line Plot Worksheets and Templates: Engage kids with worksheets and ready-made templates tailored to their grade level. Our resources combine education with entertainment, offering a structured and visually appealing way to practice creating and interpreting line plots. The varying levels of difficulty ensure that each student finds an appropriate challenge, keeping them both engaged and motivated.
- Practice Creating and Interpreting Line Plots: Provide ample opportunities for hands-on practice. Encourage students to create their own line plots using the data sets provided or those they gather themselves. As they engage in this process, they refine their skills in plotting points accurately and making organized line plot graphs.
- Transition to Interesting Data Sets: Gradually transition to more interesting and complex data sets. As students progress through different scenarios, they refine their ability to handle varying degrees of difficulty. The shift to more intriguing topics keeps them enthusiastic and invested in the learning journey.
Line Plot Examples and Activities to Use in Your Classroom
With a wealth of line graph worksheets for grade 4 and line plot worksheets 3rd grade, educators can guide young learners through the captivating process of understanding and making line plots. The best part? There's a treasure trove of free printable line plot worksheets available, making data exploration accessible to all. Here are some thought-provoking activities that bring line plot examples to life.
- Fraction Representation on Line Plots: Provide students with numbers representing the number of different colored marbles in a jar. Ask them to create a line plot that displays the fraction of each color. This activity not only reinforces their understanding, but also introduces the concept of fractions in a practical context.
- Answering Questions with Line Plots: Distribute a line plot worksheet that depicts the number of books read by each student in a class over a month. Ask questions such as "How many students read 5 books?" or "What's the most common number of books read?" This encourages students to interpret the information and answer questions based on the information presented.
- Creating Custom Line Plot Worksheets: Divide the class into groups and assign each group a different data set, like the number of pets owned by students or their favorite fruits. Provide them with free line plot worksheets with questions for their peers to solve. This collaborative activity challenges students to think critically about the data they're representing and analyzing.
- Comparing Line Plots and Bar Graphs: Present students with a line plot and a bar graph representing the same data, such as the temperatures recorded over a week. Engage them in a discussion about the differences and similarities between the two types of graphs.
- Interpreting Data Sets: Present students with a line plot that displays the number of pencils sold by a shop each day for a month. Have them analyze and identify trends, such as the days with the highest and lowest sales. Encourage them to draw and conclusion and explain why they think certain days had more sales than others.
- Creating a Line Plot Showcase: Organize a "Line Plot Showcase" where students present their own line plot projects to the class. Each student can choose a topic they're interested in, gather data, and create a line plot along with questions for their peers. This activity combines creativity, data analysis, and presentation skills.
As you immerse yourself in the world of data visualization, consider expanding your toolkit with related concepts like the plot diagram and narrative arc, which illustrate story structures. For a different perspective, explore the circle chart template for representing proportions and the table chart template for organized data presentation. Additionally, the t-chart template is a handy tool for comparisons. Incorporating these varied visualization methods enriches your ability to convey information effectively and adapt to different data scenarios.
How to Make a Line Plot Worksheet
Choose One of the Premade Templates
We have lots of templates to choose from. Take a look at our example for inspiration!
Click on “Copy Template”
Once you do this, you will be directed to the storyboard creator.
Give Your Worksheet a Name!
Be sure to call it something related to the topic so that you can easily find it in the future.
Edit Your Worksheet
This is where you will include directions, specific images, and make any aesthetic changes that you would like. The options are endless!
Click "Save and Exit"
When you are finished, click this button in the lower right hand corner to exit your storyboard.
Next Steps
From here you can print, download as a PDF, attach it to an assignment and use it digitally, and more!
Happy Creating!
Frequently Asked Questions About Line Plot Worksheets
What's the difference between a line plot and a line graph?
It is a simple representation of information using Xs or dots on a number line, showing frequency. A line graph, on the other hand, uses lines to connect points, illustrating trends or changes over time.
Where can I find free line plot worksheets for practice?
You can access a variety of worksheets at Storyboard That. These worksheets provide valuable practice in creating, interpreting, and analyzing line plots.
Is there a tool to create line plots easily?
Absolutely! Storyboard That offers a line plot creator that allows you to create a line plot worksheet. Also known as a line plot maker or line plot generator, this tool allows you to input information and generate visual representations effortlessly.
© 2026 - Clever Prototypes, LLC - All rights reserved.
StoryboardThat is a trademark of Clever Prototypes, LLC, and Registered in U.S. Patent and Trademark Office

