Customize Graph Templates

What are Graphs?
Graphs are visual representations of data, presenting information in the form of charts, diagrams, or plots. They enable students to interpret complex data sets, plot ordered pairs, identify patterns, and draw meaningful conclusions. By working with graphs, kids learn foundational data representation skills essential for various academic subjects and real-world applications.
Different Types of Graphs
Data representation is a crucial skill that empowers educators and students to make sense of information effectively. Graphs play a pivotal role in presenting data collection in a visually compelling manner, making complex information easier to comprehend. In this section, we will explore various types of graphs, including bar graphs, line graphs, and pie charts:
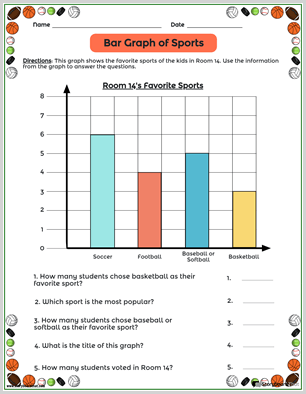
- Bar Graph: Also known as bar charts, they are versatile tools for used to represent data. Using rectangular bars of varying lengths, bar graphs showcase data in distinct categories, with the length of each bar corresponding to the quantity or value of that category. Ideal for comparing data across multiple categories, bar graphs are commonly used in displaying survey results, population statistics, and other data sets with discrete categories. Check out Storyboard That's bar graph maker today!
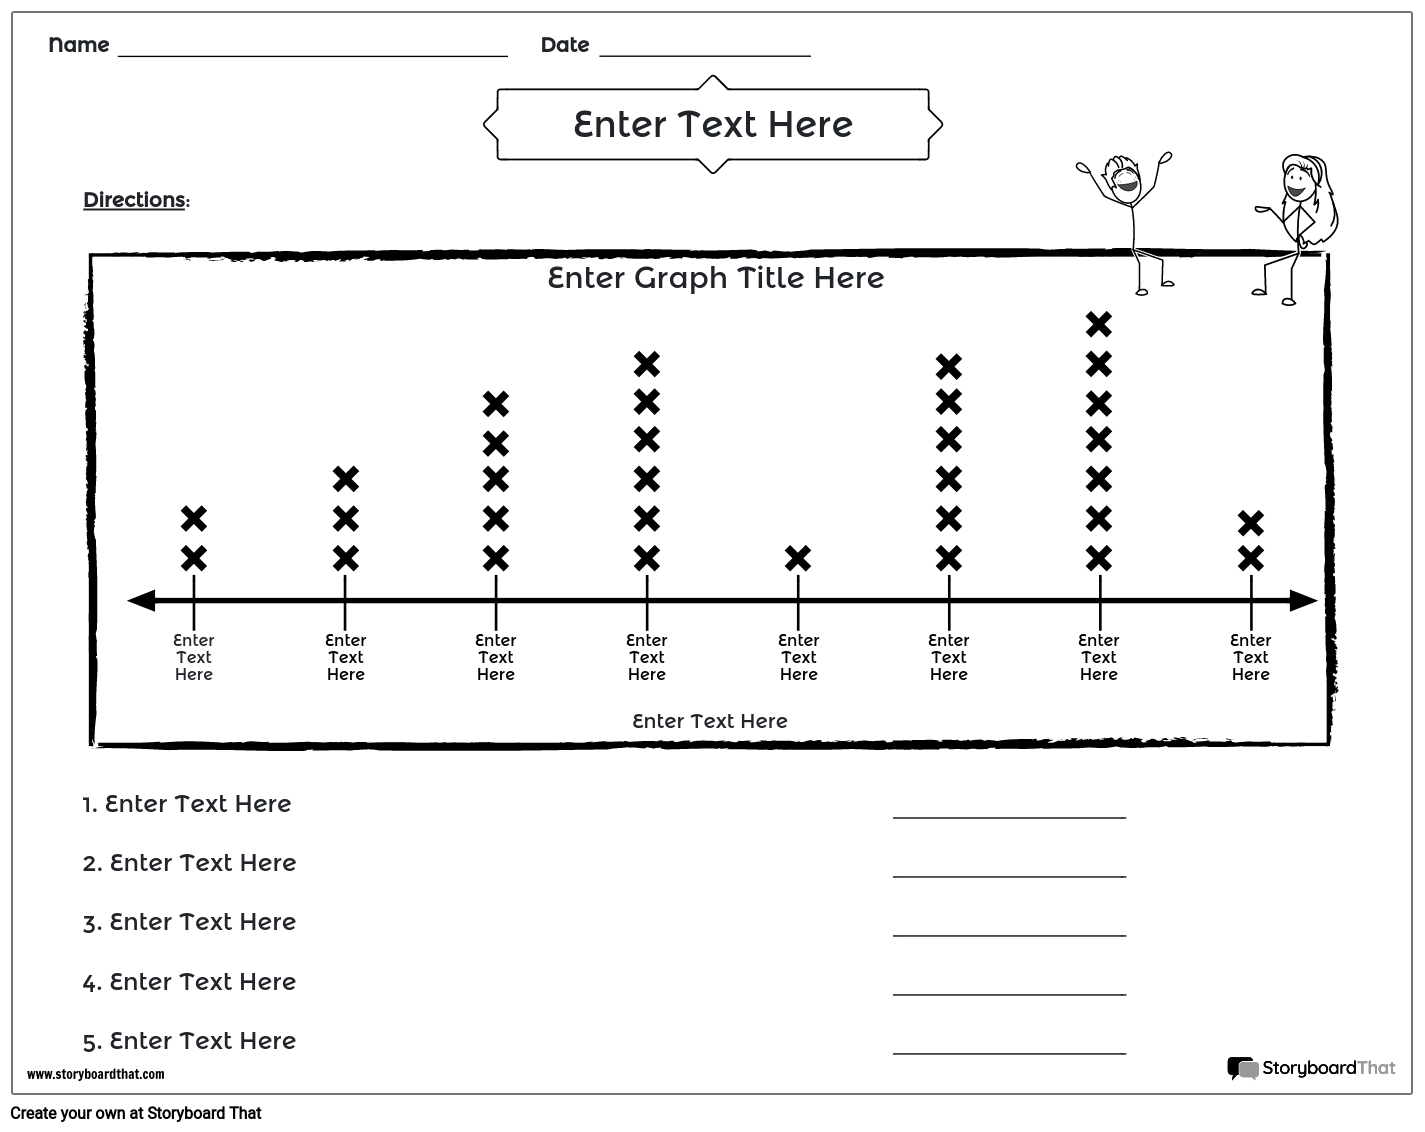
- Line Graph: They are excellent at illustrating trends and changes over time. By connecting data points with continuous lines, line graphs effectively depict the relationship between variables and their progression. Line plots, or dot plots, is another useful method for data representation including ordered pairs. They showcase the distribution of data by plotting individual data points along a number line.
- Pie Graph: What are pie graphs? Also known as circle graphs, they offer a clear representation of the parts of a whole. Each slice of the circle corresponds to a different category, with the size of the slice representing the percentage it contributes to the whole data set. Pie charts are particularly useful for displaying percentages and fractions, making it easy to interpret data and grasp the relative proportions of each category within the whole.
How to Use a Graphing Worksheet to Enhance Your Classroom Activities
Incorporating our graphing worksheets into your regular activities is a fantastic way to elevate data representation lessons and engage your class in interactive learning. With a diverse selection of worksheets, our resources cater to various grade levels and learning objectives and make learning fun and meaningful for all students.
Kindergarten and Early Elementary Grades
Bar Graph Bonanza: Introduce young learners to bar graphs using our colorful and straightforward worksheets. Learners can gather data on their favorite fruits, colors, shapes, or animals and create bar graphs to represent the information. This activity not only reinforces counting skills but also nurtures an appreciation for data representation.
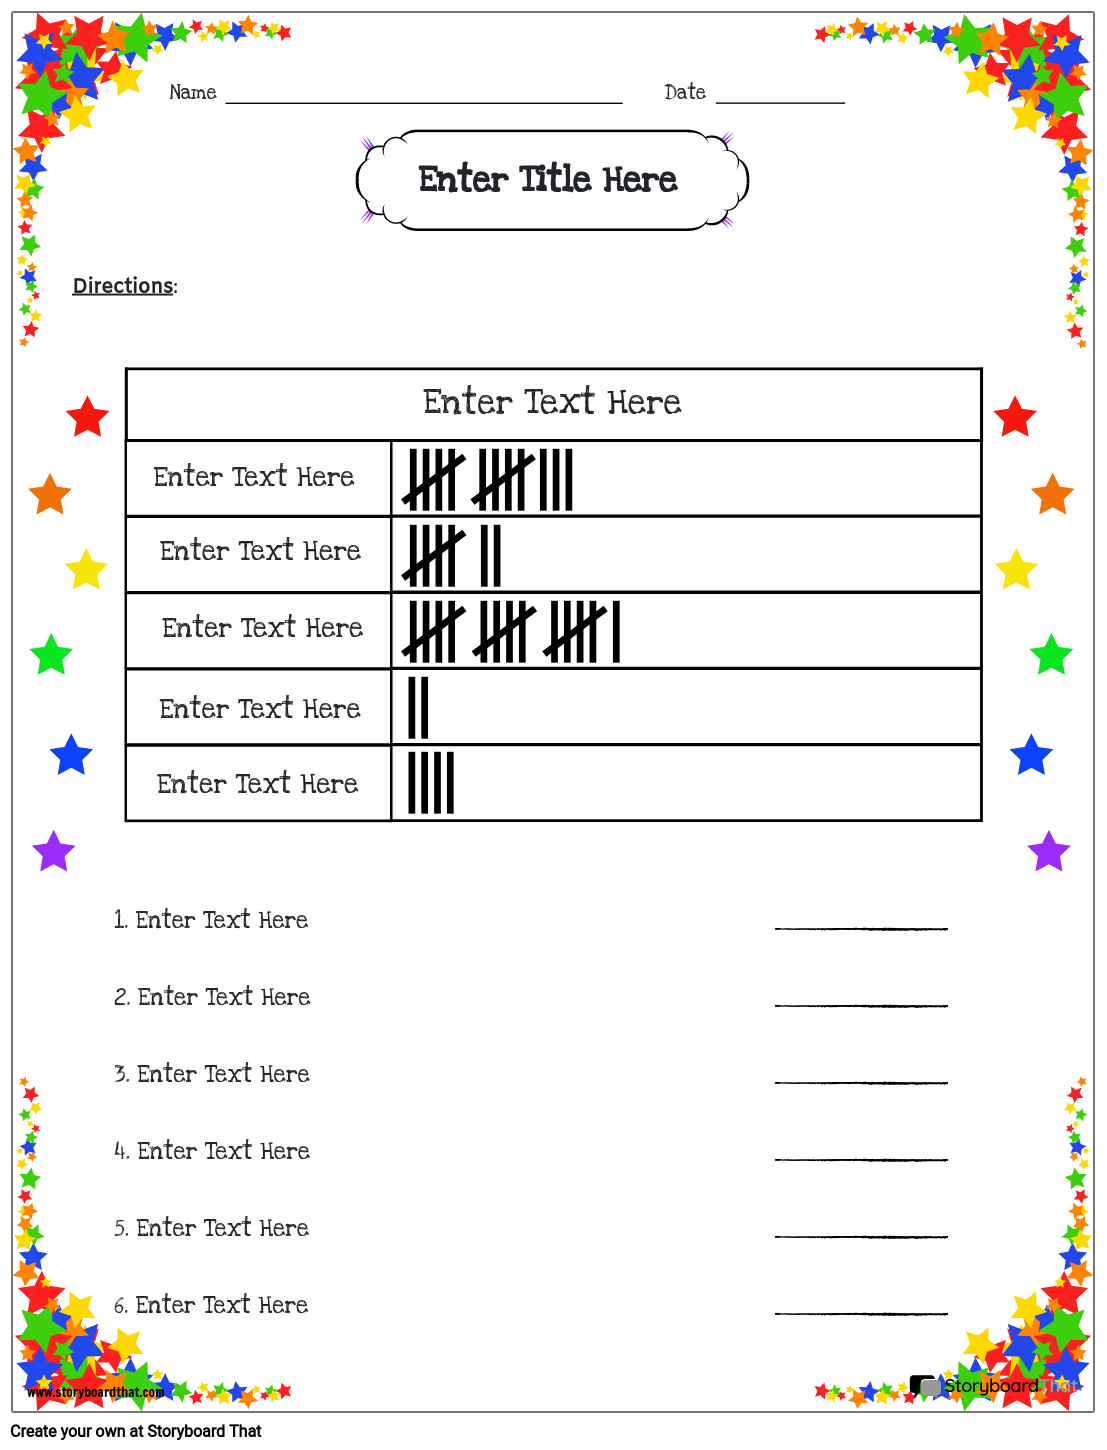
Tally Mark Tussle: Practice counting and comparing tally marks with our worksheets. Children can participate in fun games like "Tally and Compare" where they gather data through class surveys and then represent the data using tally marks. The class can then compare their findings and create simple bar charts together.
Upper Elementary and Middle School Grades
Line Graph Lessons: Dive into more complex data representation with our worksheets. Students can interpret real-world data, such as temperature changes throughout a week or a month, using our templates. This activity encourages critical thinking and data analysis as they interpret trends and patterns in the line graphs.
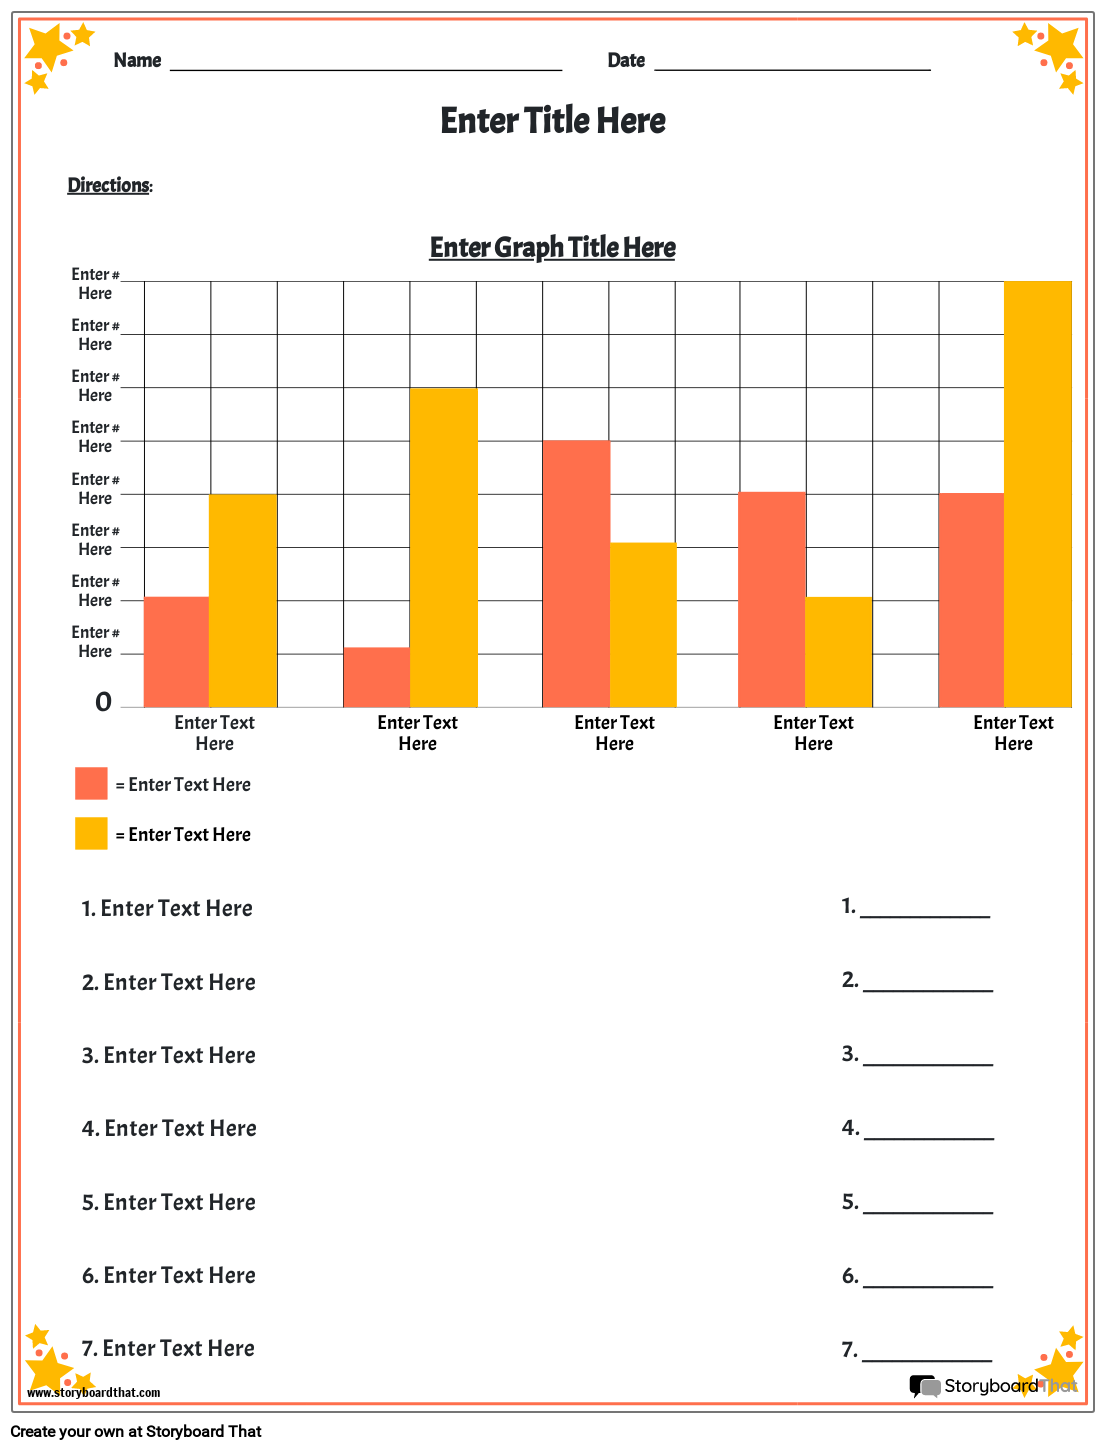
Double Bar Graph Delight: Introduce your class to double bar graphs using our interactive worksheets. Students can collect data on favorite sports, movies, or books and create double bar graphs to compare two sets of data. This activity fosters a deeper understanding of comparative data representation.
High School Grades
Coordinate Grid Challenge: Engage high schoolers with coordinate grid worksheets that delve into advanced concepts like graphing equations and plotting points. They can solve real-world word problems using coordinate grids, encouraging analytical thinking and application of mathematical skills.
Shapes on a Bar Chart: For an interdisciplinary approach, incorporate graphing worksheets into art class. Artists can create bar charts to display the frequency of various shapes they observe in artworks or architecture. This activity blends data representation with creativity, enhancing students' appreciation for both subjects.
Our Graphing Worksheets offer tons of activities suitable for different grade levels and settings. By utilizing our math worksheets resources, educators can create engaging lessons that develop data representation skills and critical thinking.
Storyboard That offers a diverse range of tools to enrich activities. From table worksheet templates that promote organized data representation to plot diagram worksheets that enhance storytelling and critical thinking, our platform has it all. Utilize the t-chart maker for comparing and contrasting ideas, or explore creative possibilities with our circle chart template for visualizing data in a circular format. Additionally, educators can foster process mapping and problem-solving skills using our create flow chart worksheets.
A Step-by-Step Guide to Creating Graphs for Engaging Classroom Activities
Are you looking to elevate your activities with visually appealing and informative graphs? Our graph maker online offers a user-friendly experience, empowering educators to craft custom graphs for data representation lessons and beyond.
- Select the Type: Begin by choosing the appropriate type that best suits your data and learning objectives. Our graph creator offers a variety of options, including bar graphs, line graphs, pie charts, scatter plots, and more. Consider the nature of your data and the story you want to tell through the data.
- Enter Data Points: Once you've selected the type, input your data points into the creator. You may need to provide categories, labels, or numerical values. Our intuitive interface makes data entry a breeze, ensuring a smooth and efficient process.
- Customize the Appearance: Enhance the visual appeal of your worksheet by customizing its appearance. Adjust colors, fonts, labels, and axis titles to align with your room theme or subject matter. Personalizing not only adds creativity but also makes it more engaging for kids.
- Add Captions and Descriptions: Include relevant captions and descriptions to provide context and clarity. Explain the significance of the data, the variables being represented, and any patterns or trends that emerge from the information presented. Clear explanations will help kids grasp the data's meaning effectively.
How to Create a Graph Worksheet
Choose One of the Premade Templates
We have lots of templates to choose from. Take a look at our example for inspiration!
Click on “Copy Template”
Once you do this, you will be directed to the storyboard creator.
Give Your Worksheet a Name!
Be sure to call it something related to the topic so that you can easily find it in the future.
Edit Your Worksheet
This is where you will include directions, specific images, and make any aesthetic changes that you would like. The options are endless!
Click "Save and Exit"
When you are finished, click this button in the lower right hand corner to exit your storyboard.
Next Steps
From here you can print, download as a PDF, attach it to an assignment and use it digitally, and more!
Happy Creating!
Frequently Asked Questions About Graph Worksheets
What are bar graph worksheets?
They are educational resources designed to help students practice data representation using bar graphs. These worksheets feature various data sets and prompts that guide students in creating and interpreting bar graphs to visualize information effectively.
What other types of graphing worksheets are available?
In addition to these worksheets, our platform offers a wide range of graphing worksheets, including line graphs, pie charts, line plots, and more. These diverse resources cater to various subjects and grade levels, enriching data representation lessons across the curriculum.
How can I make a graph using the graph creator?
Using the creator is a straightforward process. First, select the desired type (e.g., bar, line, etc.). Next, enter your data points into the creator and customize the appearance to suit your preferences. Finally, review and save your work to use in your classroom activities.
© 2026 - Clever Prototypes, LLC - All rights reserved.
StoryboardThat is a trademark of Clever Prototypes, LLC, and Registered in U.S. Patent and Trademark Office


