Customize a Graphic Organizer!
Graphic organizers are visual tools that help students organize and represent information in a structured and meaningful way. These tools are widely used in classrooms to support learning and comprehension across various subjects. Here are just a few types of graphic organizers that can be found on Storyboard That and used immediately in your lessons:
- Venn Diagrams:Venn diagrams are used to show the commonalities and differences between two or more sets of items. Students can use Venn diagrams to compare and contrast characters in literature, historical events, or scientific concepts.
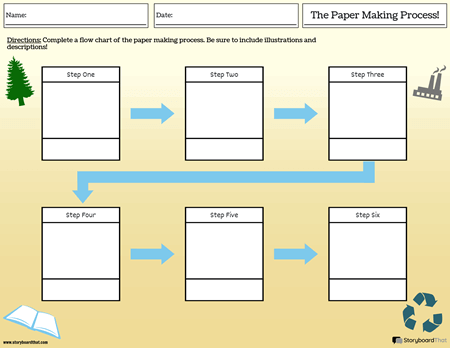
- Flowcharts: Flowcharts represent a series of steps or processes in a visual format. Teachers can use flowcharts to illustrate procedural instructions. Students can create flowcharts to outline the steps of a scientific experiment or a historical event.
- KWL Charts: KWL (Know, Want to know, Learned) charts help students organize their thoughts before, during, and after learning about a topic. Students can fill in the KWL chart at the beginning of a lesson to identify what they already know, what they want to learn, and what they have learned by the end of the lesson.
- Spider Maps: Spider maps (or radial maps) are used to explore and organize ideas around a central theme. Students can use spider maps for brainstorming and organizing information related to a specific topic.


Happy Creating!
How Tos about Graphic Organizer Worksheets
How can I create custom graphic organizers tailored to my lesson objectives?
Design a graphic organizer with your lesson goals in mind. Select the type (e.g., Venn diagram, flowchart) that best supports your objective, then personalize headings, prompts, and layout to fit your students’ needs.
Choose the best format for your activity.
Pick the organizer that matches your lesson's purpose. For comparing concepts, use a Venn diagram; for sequencing, opt for a flowchart. This ensures students focus on the right skills.
Add clear instructions and examples.
Help students get started by modeling a sample. Write step-by-step directions and fill in part of the organizer with a familiar topic to demonstrate expectations.
Encourage student creativity and ownership.
Let students customize their organizers with colors, images, or personal notes. This boosts engagement and helps them connect ideas to prior knowledge.
Review and reflect on completed organizers.
Set aside time for students to share and discuss their work. Ask guiding questions to deepen understanding and reinforce key concepts.
Frequently Asked Questions about Graphic Organizer Worksheets
What are graphic organizers and how do they help students learn?
Graphic organizers are visual tools that help students structure and represent information. They promote better understanding by allowing learners to organize ideas, make connections, and improve comprehension across subjects.
Which graphic organizers are best for comparing and contrasting information?
Venn diagrams are ideal for comparing and contrasting two or more items. They visually display similarities and differences, making them perfect for analyzing characters, events, or concepts in any subject.
How can I use flowcharts in my classroom lessons?
Teachers can use flowcharts to break down processes, illustrate procedural steps, or outline scientific experiments. Flowcharts help students visualize sequences and improve their understanding of complex tasks.
What is a KWL chart and when should I use one?
A KWL chart stands for Know, Want to know, Learned. It helps students track prior knowledge, set learning goals, and reflect on new information. Use it at the beginning, during, and end of a lesson for effective engagement.
Where can I find ready-to-use graphic organizer templates for my lessons?
You can find ready-to-use graphic organizer templates on Storyboard That. These templates save time and can be immediately incorporated into your lesson plans for various subjects and grade levels.
© 2026 - Clever Prototypes, LLC - All rights reserved.
StoryboardThat is a trademark of Clever Prototypes, LLC, and Registered in U.S. Patent and Trademark Office
