Lesson Plan Overview
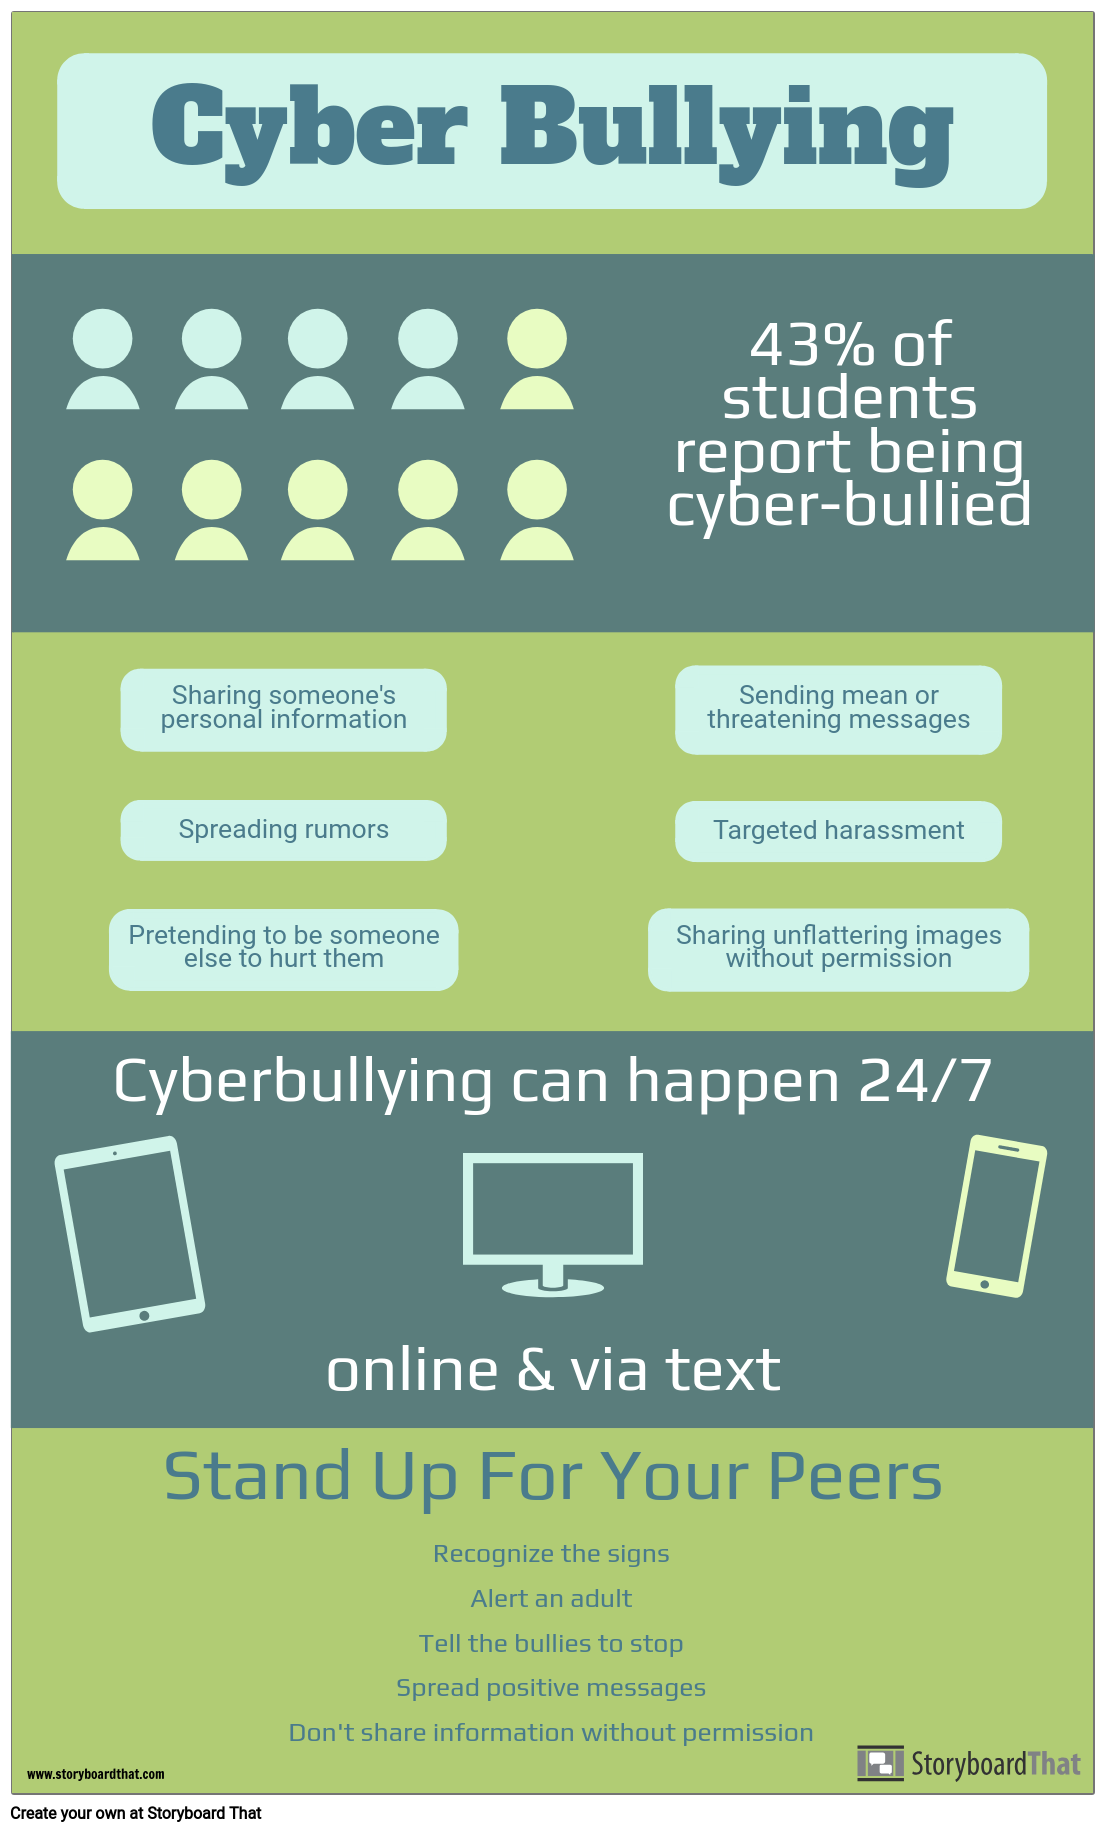
While learning about the signs of bullying, it's key for students to also understand the numbers. They may not know how widespread an issue it is or they may feel like they're the only one. Creating an infographic PSA is a great way to familiarize students with the statistics of bullying. They can choose to focus on one type of bullying, like physical, verbal, or cyber, or analyze bullying as a whole.
Students should use sites like www.bullyingstatistics.org or https://www.stopbullying.gov as a starting point for their infographic to ensure they have the most up to date statistics. To extend the activity, consider asking students to compare bullying statistics from ten years ago to what they are today. Have they gone down? Up? Why might that be?
The complexity of this activity can be tailored for any age group, and the instructions are customizable so you can be sure your students completely understand the assignment! For additional templates to add to this assignment, check out our infographic template gallery!
Template and Class Instructions
(These instructions are completely customizable. After clicking "Copy Activity", update the instructions on the Edit Tab of the assignment.)
Student Instructions
Create an infographic PSA about bullying.
- Click "Start Assignment".
- Enter important statistics and information into the textables.
- Add or change any infographics, textables, and images as desired.
- Save and exit when you're done.
Lesson Plan Reference
How Tos about Creating a Bullying Infographic
Engage Students with a Class Discussion on Bullying Solutions
Start your lesson by organizing a class discussion about real-life solutions to bullying. This encourages students to think critically and share their own ideas for positive change.
Brainstorm Solutions as a Group
Invite students to brainstorm ways to prevent bullying in your school. Group brainstorming fosters creativity and helps students take ownership of anti-bullying efforts.
Create a Classroom Anti-Bullying Pledge
Guide students to draft a simple anti-bullying pledge together. Writing and displaying a pledge serves as a daily reminder of your classroom’s shared values.
Display Student Solutions Alongside Infographics
Display the class’s solutions or pledges next to their infographics. This highlights student voice and makes your classroom a positive, action-oriented space.
Frequently Asked Questions about Creating a Bullying Infographic
What is a bullying infographic and how can it help students understand bullying?
A bullying infographic is a visual poster or graphic that presents key facts, statistics, and information about bullying. It helps students understand the scope, types, and impact of bullying in a clear and engaging way, making complex data more accessible and memorable.
How can I guide students in creating an effective bullying infographic?
To guide students, encourage them to research up-to-date bullying statistics from reputable sources like stopbullying.gov, focus on a specific type of bullying or overall trends, and use visuals, clear text, and relevant images. Remind them to keep the infographic simple, factual, and visually engaging.
Where can I find reliable statistics for a bullying infographic?
You can find reliable bullying statistics at websites such as www.bullyingstatistics.org and https://www.stopbullying.gov. These sites provide current, research-backed data suitable for educational infographics.
What are some tips for making a bullying infographic suitable for middle and high school students?
Use age-appropriate language, include relevant statistics, and focus on issues students might encounter, like cyberbullying or verbal bullying. Visuals should be clear and not overwhelming, and the content should encourage discussion and empathy.
Why is it important for students to compare current bullying statistics with those from the past?
Comparing past and present bullying statistics helps students recognize trends, understand whether prevention efforts are effective, and discuss reasons for changes. This analysis encourages critical thinking and awareness of ongoing challenges.
More Storyboard That Activities
Anti Bullying Activities
This Activity is Part of Many Teacher Guides
Testimonials

“By using the product, they were so excited and they learned so much...”–K-5 Librarian and Instructinal Technology Teacher

“I'm doing a Napoleon timeline and I'm having [students] determine whether or not Napoleon was a good guy or a bad guy or somewhere in between.”–History and Special Ed Teacher

“Students get to be creative with Storyboard That and there's so many visuals for them to pick from... It makes it really accessible for all students in the class.”–Third Grade Teacher
© 2026 - Clever Prototypes, LLC - All rights reserved.
StoryboardThat is a trademark of Clever Prototypes, LLC, and Registered in U.S. Patent and Trademark Office


