Оптимизация шаблонов фреймворка для объяснения результатов теста

Клиенты часто взаимодействуют с продуктами и услугами удивительно креативными способами, а не следуют вашему тщательно разработанному плану. Могут быть неожиданные результаты различных аналитических тестов, которые невозможно объяснить только цифрами. Визуальное отображение процесса того, что, по вашему мнению, происходит, помогает поделиться гипотезой с другими и пролить свет на то, что произошло во время теста. Эти идеи могут привести к появлению новых продуктов или фундаментальным изменениям в вашей бизнес-модели. В книге « Бережливый стартап» Эрика Райса подробно об этом говорится.
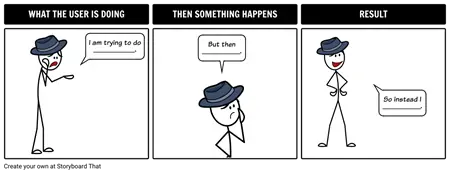
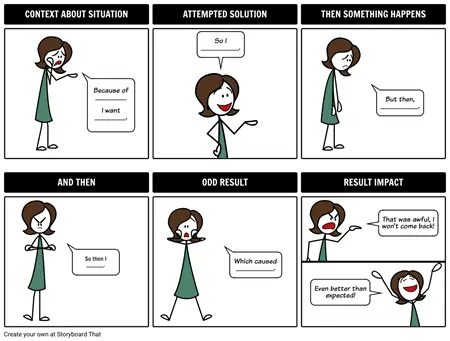
Структура для них такова: Это – Потом То – Результат.
- Это: Что начал делать пользователь?
- И что они сделали потом ?
- Результат: Последствия действий пользователя.
Примеры раскадровки

Как объяснить неожиданные результаты с помощью шаблонов фреймворка
Engage students with interactive storyboard activities that explain test results
Transform test result explanations into interactive learning by having students create their own storyboards. This method helps students visualize the process, understand cause and effect, and develop critical thinking skills.
Introduce the 'This – Then That – Result' framework using real-life classroom examples
Start by sharing relatable scenarios (like a science experiment or math problem) and break them down using the framework. Students will see how actions lead to results, making abstract concepts more concrete.
Guide students to brainstorm and sketch their own storyboards
Encourage students to choose a classroom test or project and outline each step with drawings or digital storyboards. This hands-on approach boosts engagement and supports visual learners.
Facilitate peer sharing and discussion of storyboard explanations
Organize students into pairs or small groups to present their storyboards. Peer feedback sparks new ideas and reinforces understanding through collaboration.
Reflect on how visual storytelling clarifies test outcomes
Wrap up by asking students to share what they learned from visualizing test results. Reflection deepens comprehension and encourages metacognitive skills.
Часто задаваемые вопросы об объяснении непредвиденных результатов с помощью шаблонов фреймворков
What is a framework template for explaining test results?
A framework template for explaining test results is a structured approach that helps educators and teams clearly communicate test outcomes. It typically breaks down findings into steps like This – Then That – Result to make analysis easy to follow and actionable.
How can I use storyboard examples to explain unexpected test results in class?
You can use storyboard examples to visually map out the sequence of student actions, outcomes, and consequences. This makes it easier for students to understand complex or surprising results, fostering discussion and deeper learning.
Why is visualizing test processes helpful for students?
Visualizing test processes helps students see the steps and logic behind results, making abstract concepts more concrete. This approach encourages engagement and critical thinking, especially when results are not what they expected.
What are the benefits of using 'This – Then That – Result' for lesson planning?
Using the This – Then That – Result structure in lesson planning provides clarity, encourages step-by-step thinking, and helps educators pinpoint where learning gaps or misunderstandings may occur.
Can framework templates be adapted for different grade levels or subjects?
Yes, framework templates are flexible and can be customized for any grade level or subject area. Adjust the complexity of each step to suit your students’ needs and subject matter.
© 2026 - Clever Prototypes, LLC - Все права защищены.
StoryboardThat является товарным знаком Clever Prototypes , LLC и зарегистрирован в Бюро по патентам и товарным знакам США.

